 19:09
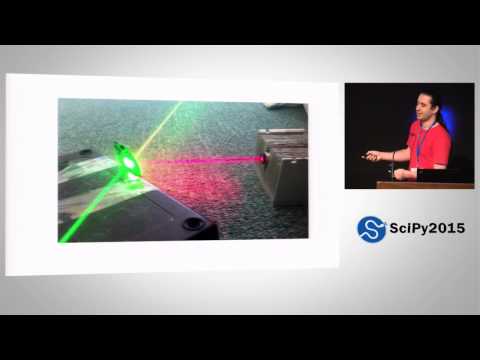
A Better Default Colormap for Matplotlib | SciPy 2015 | Nathaniel Smith and Stéfan van der Walt
Enthought
15 HN recommenders
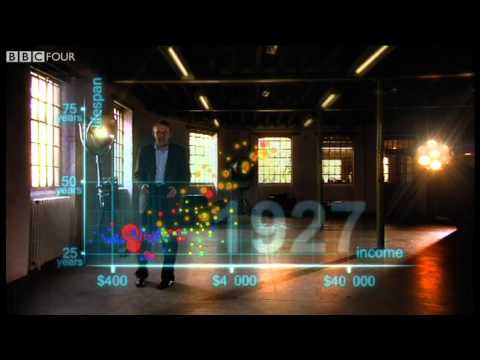
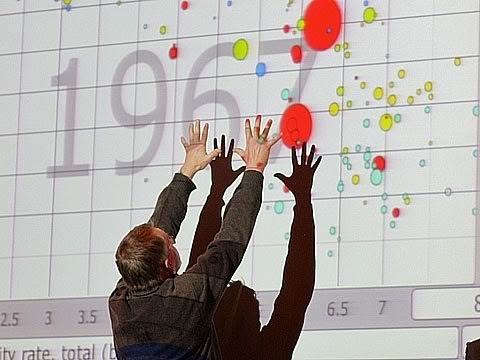
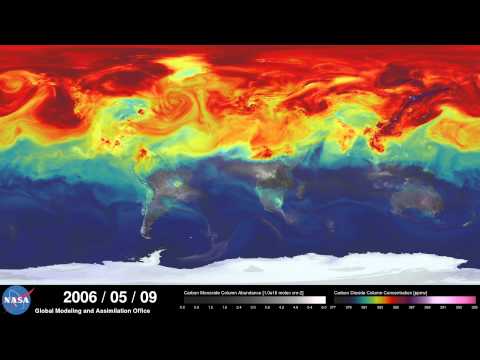
Data visualization: charts, maps, infographics, Edward Tufte, Hans Rosling, interactive visualization, D3, time-lapse data art, visual explanations of data.
19:09Enthought
15 HN recommenders
 4:48
 58:51
 9:09
 6:08
 19:10
 20:36
 23:12
 6:40
 13:21
 16:37
THINK Global School
4 HN recommenders
 20:36
 39:33
 35:16
 1:01:50
 14:48
 10:16
 42:15
 11:42
TED
2 HN recommenders
 18:33
 4:32
 3:11
 9:16
 11:24
Indie Picks is organized from video metadata and uploader descriptions; it is not a full-video editorial review. HN Library retains community discussions. Sources and data notes